

Quantitative Reasoning: Understanding Inductive and Deductive Learning Through A Practical Exploration with AI and Data Analysis
This hands-on AI lesson bridges theory and practice, sharpening your inductive-deductive reasoning while mastering real-world regression skills—no fluff, just cognitive growth.

This lesson integrates AI-driven exploration with hands-on data analysis, offering a fresh perspective on mastering inductive and deductive reasoning. Students will engage with LLMs and practical regression tasks in R while developing critical cognitive skills and gain real-world analytical expertise in a uniquely structured, interactive way.
Lesson Instructions:
Before reading the assigned article and the suggested one, select a Large Language Model (LLM) of your choice and type in: Easily explain and illustrate with simple examples the key differences between inductive and deductive learning methods
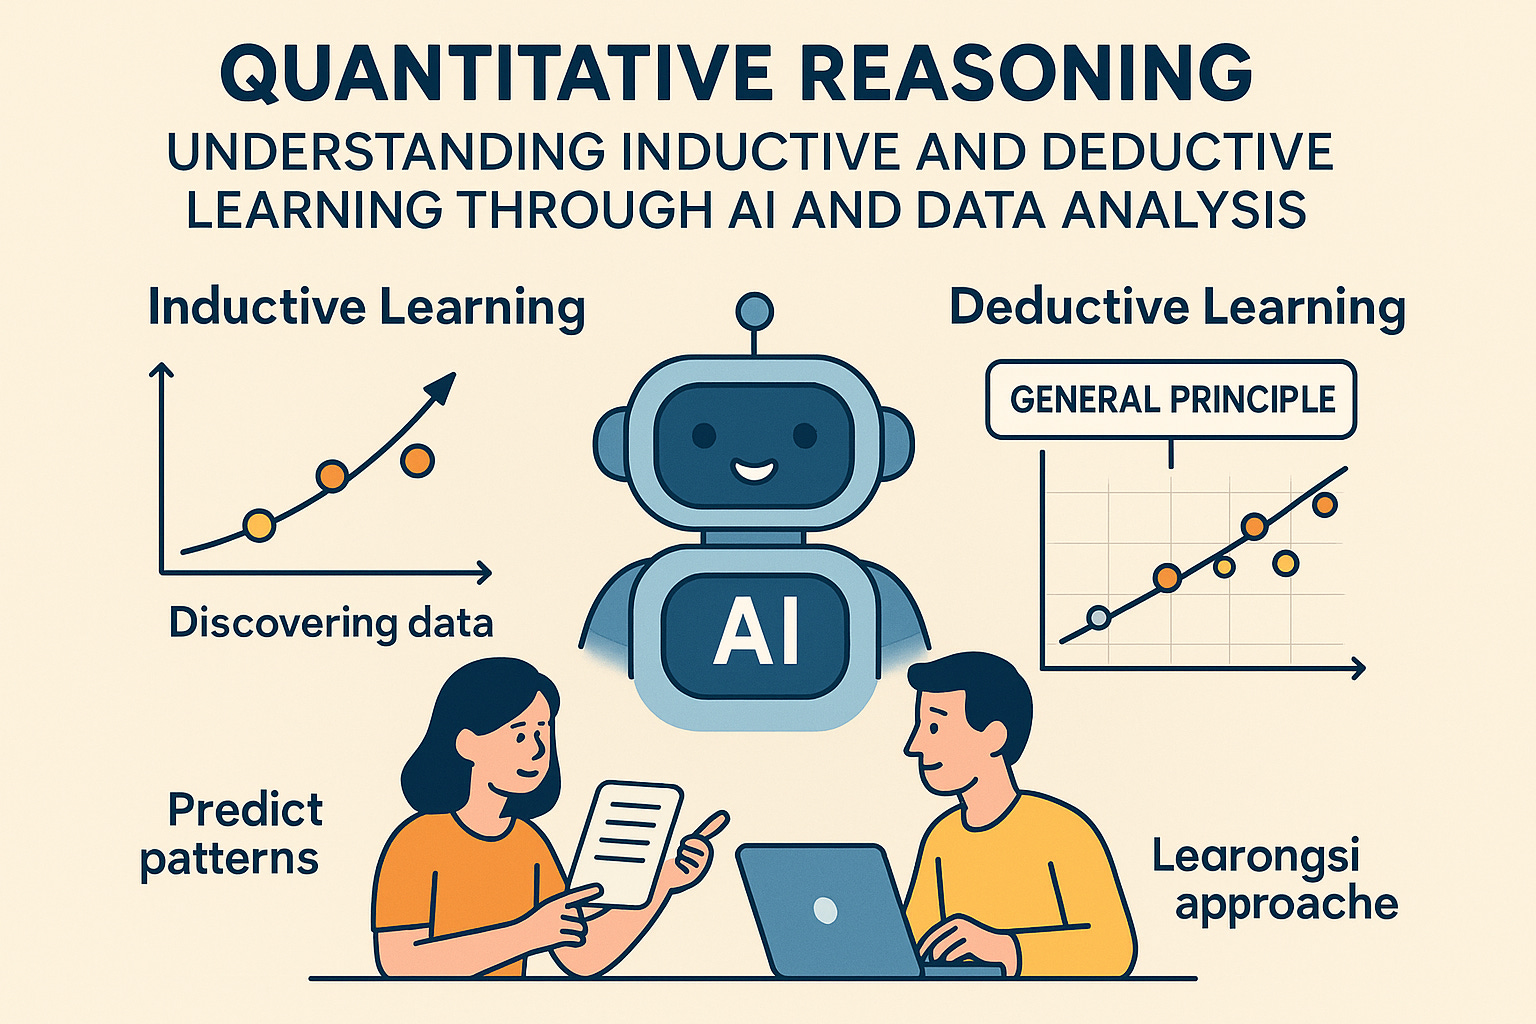
Inductive Learning
In the LLM of your choice type in: create a simple, small and mock dataset for the following theme: xxx. Disclose which LLM you selected. I used CoPilot this time around but feel free to experiment with other ones such as Gemini, Perplexity, ChatGPT, Claude, Llama, You, Kagi, DeepSeek, Grok, Poe, etc. Pay attention to the limited free daily quota of each model, particularly Claude.
Now type in in the same model: identify key patterns and relationships in this dataset
Once you internalize this information, add: predict how changes in xxx modify the original patterns and relationships
After digesting the former output, continue the conversational search with the following prompt: formulate general principles of linear regression based on these observations
Share a brief but original reflection on what you think of inductive approach as a learning method to understand the relationships between xxx
Deductive Learning
Now type in the following prompt in the same model you used above: explain what linear regression is in simple and easy terms
Move on to the following prompt once you understand the previous output: break down and easily explain through clear examples what linear regression formula encompasses
Continue the learning process using this prompt: illustrate through simple and relevant examples key assumptions and limitations of linear regression
Finally, and not rushing between each learning step, add this prompt: how does linear regression help understand patterns and relationships between xxx?
Share a brief but original reflection on what you think of deductive approach as a learning method to understand the relationships between structural racism and racial residential segregation
Challenge
Learn how to do linear regression in R, a very powerful statistical tool for data science/analytics. You definitely want to put this skill in your CV! You can download this open source software here or play with it online here or search for ‘use R online’ on Google to find other websites offering the online option.
Select one of the options below: learning with AI or learning with textbook. State which option you picked.
Your goal is to share a visual illustration of a plotted linear regression and briefly explain patterns and relationships in your own words. Feel free to use any dataset you can find online. However, you may just ask the model to create a mock dataset for you.
Learning with AI
Disclose the model you are using;
Share the prompts (not the outputs);
Share the image of your linear regression and your brief original explanation;
Reflect on (i) whether you used primarily an inductive, deductive, or mixed approach and (ii) how ‘learning with AI’ helped you (or not) in this learning method;
Share how much time you spent on this challenge.
Learning with Textbook
Access the most well-known and open source textbook for a gentle introduction to R;
Learn how to do linear regression from information provided in the textbook;
Create a mock dataset, or use a real one, to plot your linear regression;
Reflect on (i) whether you used primarily an inductive, deductive, or mixed approach and (ii) how ‘learning with textbook’ helped you (or not) in this learning method;
Share how much time you spent on this challenge.
Finally
Read the assigned reading, you find it in course syllabus. I highly encourage you to read it in its entirety but feel free to use AI to summarize it for you, if you need it. Also, read this suggested paper for class focused discussion.
PS. Only outputs shared one-hour before class starts will be included in classification feedback.
PS. Those very interested in the topic may take a look at this project.
Do not forget to like and comment your classmates' effort.
Find below examples of students’ outputs to this lesson plan:
by Elliott Stevens; tut72054@temple.edu; @elliottstevenz
1) Original reflection on what I think of an inductive approach as a learning method to understand the relationships between structural racism and racial residential segregation:
One detail that I value highly about the inductive approach is that it has a foundation in real life experiences and real-world circumstances. Instead of kind of forcing data to fit an assumed idea, inductive approaches encourage a bottom-up method to show how structural racism occurs in everyday life. For example, starting with an observation of neighborhoods with high poverty rates or unequal school funding can reveal how these systemic issues are deeply intertwined with residential segregation, leading to a more broad insight about the inequality rooted in certain areas. The inductive approach also encourages curiosity and critical thinking, and it can challenge us to look beyond common explanations and think about why certain patterns exist and also about what kind of systemic issues are at play. The inductive approach also underlines the complexity of structural racism, and recognizes that its causes and effects are rarely based on just one or two things or but also deeply rooted in historical and social contexts.
2) Original reflection on what I think of an deductive approach as a learning method to understand the relationships between structural racism and racial residential segregation:
The deductive approach, which can often can begin with broad theories and applies them to specific cases, offers a focused and structured way to study the relationships between structural racism and racial residential segregation. What I found effective about this approach is its effectiveness in testing a specific idea or data. For example, if there is a theory that suggests racial residential segregation limits access to quality education, the deductive method provides a clear pathway to test this through data analysis, and looks at specific criteria such as systemic inequality or institutionalized discrimination, and uses these terms to predict and analyze how segregation operates in housing, education, or economic opportunities. This approach is useful for confirming patterns or identifying where certain ideas fall short, and offers a way to refine our understanding. However, the deductive method has its limitations in exploring issues as complex as structural racism and it may overlook unexpected patterns or interactions. Structural/systemic racism has lots of layers to take into consideration and the deductive approach can sometimes hinder the discovery of new and insightful information.
Challenge: Learning with AI
The AI I am using is ChatGPT (free version). Prompt into ChatGPT: "I need to use R to share a visual illustration of a plotted linear regression. I can use any dataset you can find online. However, can you create a mock dataset? And how would I use this in Posit Studio Desktop? If that doesn't work, I'm available to try any free program online to do this. I would like to share the image of a linear regression." The outcome was amazing, as the AI taught me how to use R and showed me which data to input into Studio Desktop - Posit. Here is the image of Linear Regression after I followed the steps to use the free program listed Studio, and everything worked as outlined by ChatGPT.
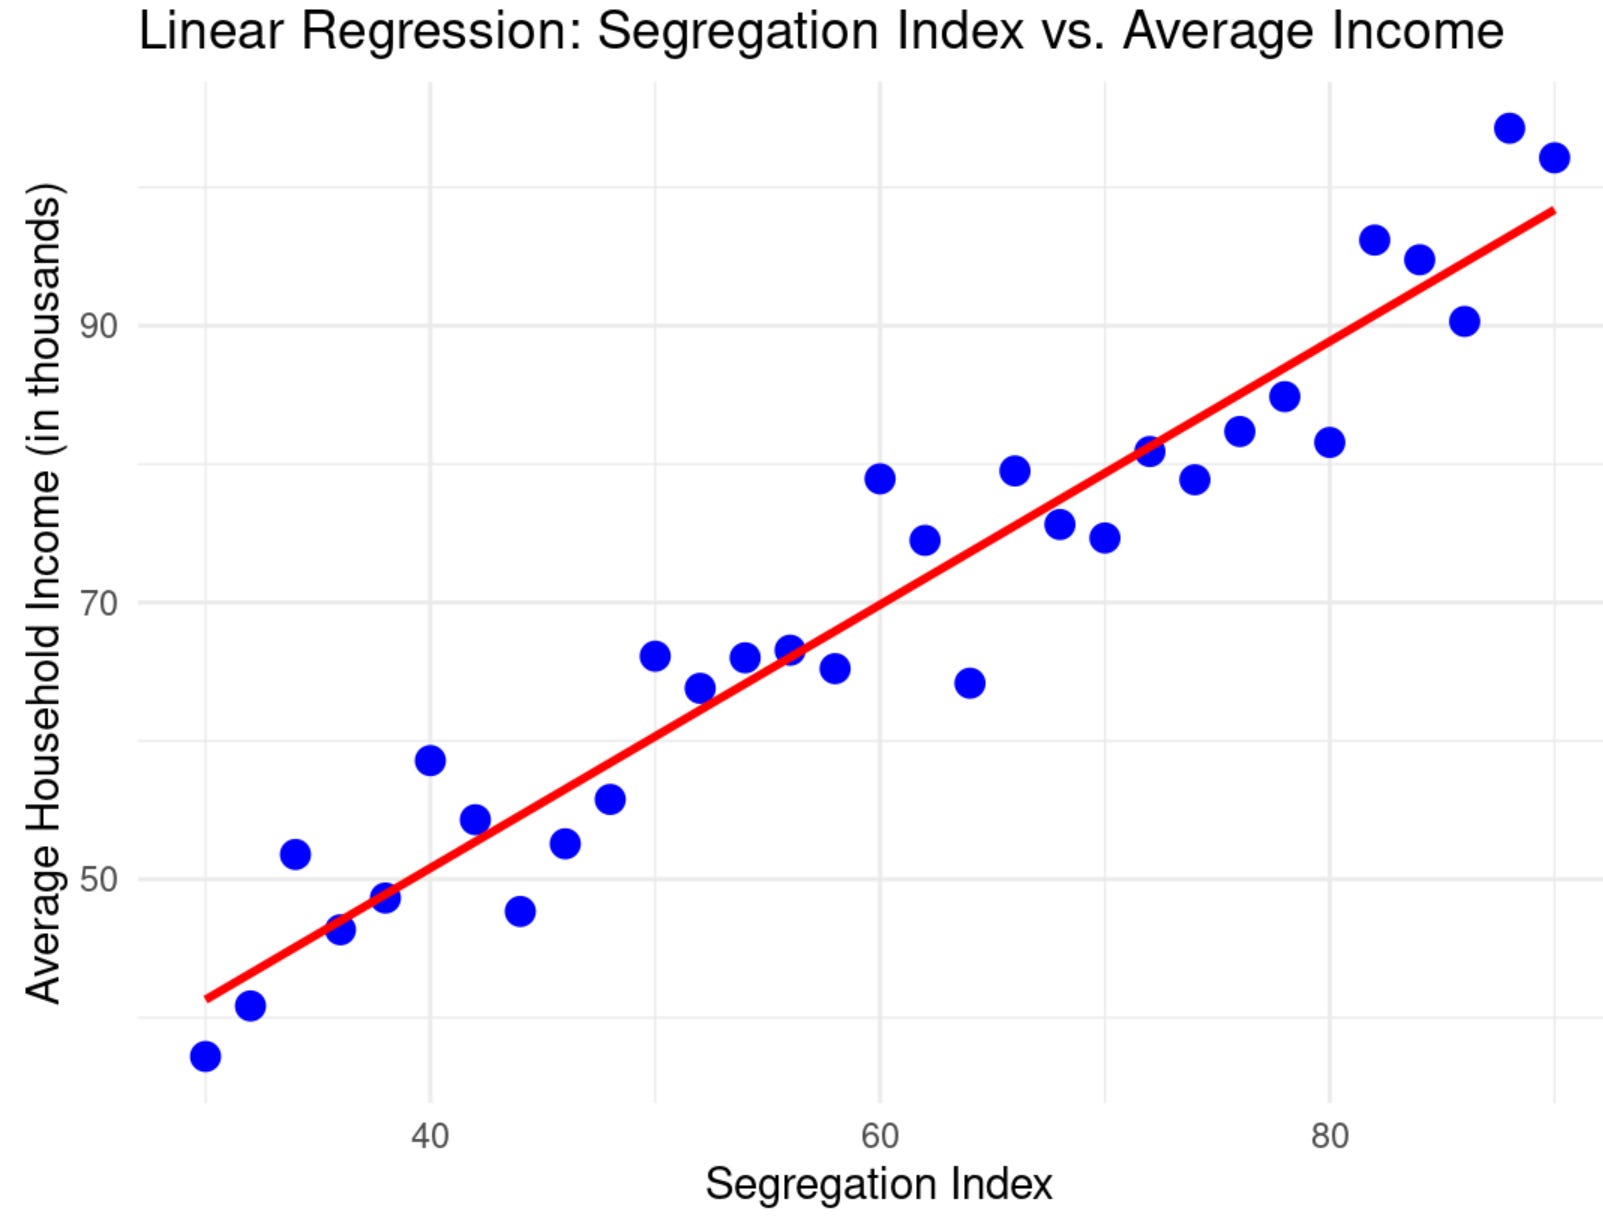
The scatterplot with the regression line shows a positive linear relationship between the segregation index and average household income. As segregation increases, the average income also tends to rise. However, the randomness in the data could indicate that segregation alone does not fully explain the variations in income. This pattern suggests that while segregation may correlate with income levels, other factors could also play a significant role.
I primarily used an inductive approach for this project. By working with specific data and observing patterns, I developed an insight about the relationship between segregation and income. This bottom-up process like I mentioned earlier allowed me to explore how the regression model visually represents these patterns.
(ii) How learning with AI Helped:
Learning with AI enhanced my understanding by simplifying complex concepts. It would've probably took me many days or weeks to learn how to do this type of skill without a teacher or the assistance of AI. ChatGPT AI provided a step-by-step guidance on linear regression, data creation, and visualization in R. I was able to focus more on interpreting patterns rather than struggling with technical tools, making the learning process more efficient and actually kind of fun. I am honestly shocked that this only took me about 2 hours to complete in total time, maybe even less. It's very encouraging that we can all adopt new skills in much less time these days, and this could boost our CV like mentioned in the assignment, and provide us more career and money making opportunities, what an exciting time to be alive!
by @emmanamii
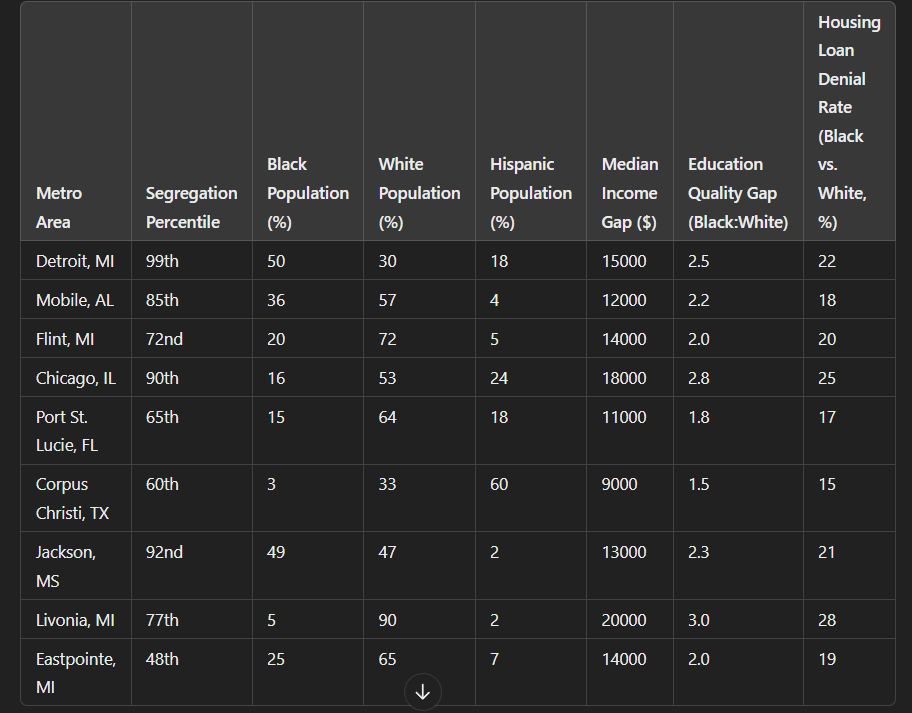
After reading the article, and highlighting a few statistics that stood out, I used those numbers and pasted it into ChatGPT, asking for it to make a dataset with these numbers.
Reflection regarding the dataset:
After prompting my LLM to identify key statistics, it felt easier to recognize and acknowledge the dataset it provided. Some things were an obvious standout, but I was intrigued in comparing socioeconomic disparities and housing loan denials. This was interesting because I learned more about an unfamiliar topic- housing loans. After, I used my LLM to help me conclude that denial rates for housing loans in segregated areas are increasing, like Livonia and Jackson climbing to over 30%.
Inductive Learning
Personal Reflection:
Inductive learning is certainly helpful because it lets us conclude data without it directly telling us so. By giving a visual representation of data, and allowing others to connect the dots on their own, it can let others strive to know more about the "image" they are presented. They may notice that one unique trend, that is different to the rest of the data, and start to question why that is. That leads them to do their own research and conclusion, to the point where they essentially search for answers or context.
However, there’s a challenge in this approach, too. Inductive reasoning requires knowing your observations may be incomplete, that what you see might not capture the full truth. It’s about letting the evidence guide you while staying open to stories that data alone can’t tell. Ultimately, inductive learning fosters a mindset of exploration and empathy. It pushes us to ask, "What am I not seeing? What patterns might I have overlooked?" In the context of understanding structural racism and residential segregation, inductive learning feels intriguing; as there is so much layered beneath this topic. As you research more and more, you begin to understand and visualize the lived realities behind the numbers of any graph or data set.
Deductive Learning
Deductive learning is similar, where we make observations and try to find reasoning. However, the difference lies in how we conclude. This learning style can be helpful when trying to confirm or deny any theories- where as in this case, it can also be stereotypes.
Applying this method to structural racism and residential segregation can be tough, as there are many aspects to consider, such as history and lived experiences; but on the other hand, one data set may also not be enough to confirm/deny a theory. It’s really about testing and searching for what we already may suspect. One thing I do admire about this approach, is that it’s the kind of thinking that holds you accountable to your claims, demanding proof for every assumption.
Challenge-Learning with AI
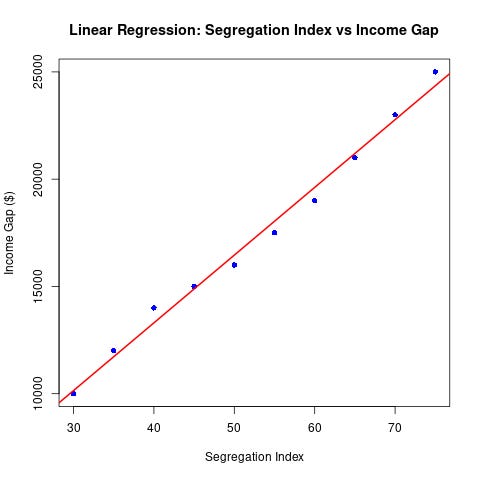
I decided to use ChatGPT to help me generate the code I out into the "Run R code online" website. I asked it, "I want to use R to create a plotted linear regression. Could you create a mock data set showing the relationship between segregation and income, and write a script to implement this?" It was amazing how easy it was to implement this, and this would've definitely taken me longer if it weren't for these AI tools.
The red line illustrates a positive linear relationship between segregation and the average household income. Although the blue points do not exactly touch the red line, we can see a similar pattern, and can conclude that there is certainly a correlation.
For this project, I adopted an inductive approach to analyze the data. I focused on specific observations and used them to identify broader patterns, which led to insights about the relationship between segregation and income. By using this method, I was able to see how individual data points interact within the regression model and how trends emerge visually. This hands-on exploration deepened my understanding of how statistical models work to represent real-world relationships, making the abstract concepts of correlation and regression much more tangible.